Econ 1101/1165—Reading 1
Auction Markets for Electricity in the United
Kingdom
By Thomas J. Holmes, Dept. of
Economics, University of Minnesota
There
are a variety of important markets throughout the world where exchange takes
place through auctions. (E.g., government bonds, internet advertising, used
cars, etc.) A discussion of how
auctions work is a good way to start an economics class because the basic
mechanism through which price is arrived at is relatively easy to understand.
This reading discusses how a particular auction works.
The
market is wholesale electricity in the United Kingdom. Before 1990, electric power in the UK was
provided by a single firm that both produced and distributed power to
consumers. (In economics, we say that
such a firm is vertically-integrated,
because the firm is at the beginning and the end of the production
process.) The firm was a government
monopoly, analogous to the way the Postal Service is a government monopoly
here. In 1990, the industry was
restructured to introduce competition into the market. The industry was privatized and firms began competing to sell
electricity. There typically remained
only a single power cable going into any particular building. But that cable would be connected to a power
grid. The electricity flowing into the
building could come from potentially numerous suppliers connected to the
grid. With all these various firms
connected to the grid, there needs to be some way of coordinating things so
that the right amount of electricity is put into the grid, to ensure the lights
go one when someone flips a switch. Since 1990, the UK has used auctions to
coordinate production and to determine the wholesale price.
To
explain how the auction works, we need to give a little background about the
electricity market. The demand for
electricity varies substantially throughout the day. The first figure below plots the total
quantity of electricity demanded in the UK over the course of the day of Sept.
3, 2014. (This data is available on the web and the sources and details about
the data are discussed below.) The
horizontal axis is the hour of the day (according to a 24
hour clock). Notice that demand
is lowest in the early morning when the lights are out
and people tend to be sleeping. On this particular day
demand was 25,000 MWh in the early morning hours. Then, after 5:00 a.m., demand began going up
until it leveled off at approximately 37,000 MWh just after 8:00 a.m. Later in the evening (at 20:00 or 8:00 p.m.)
demand began to head back down again.
Electricity Demand in Great Britain on Sept 3, 2014
(MegaWatt Hours by Time of Day)
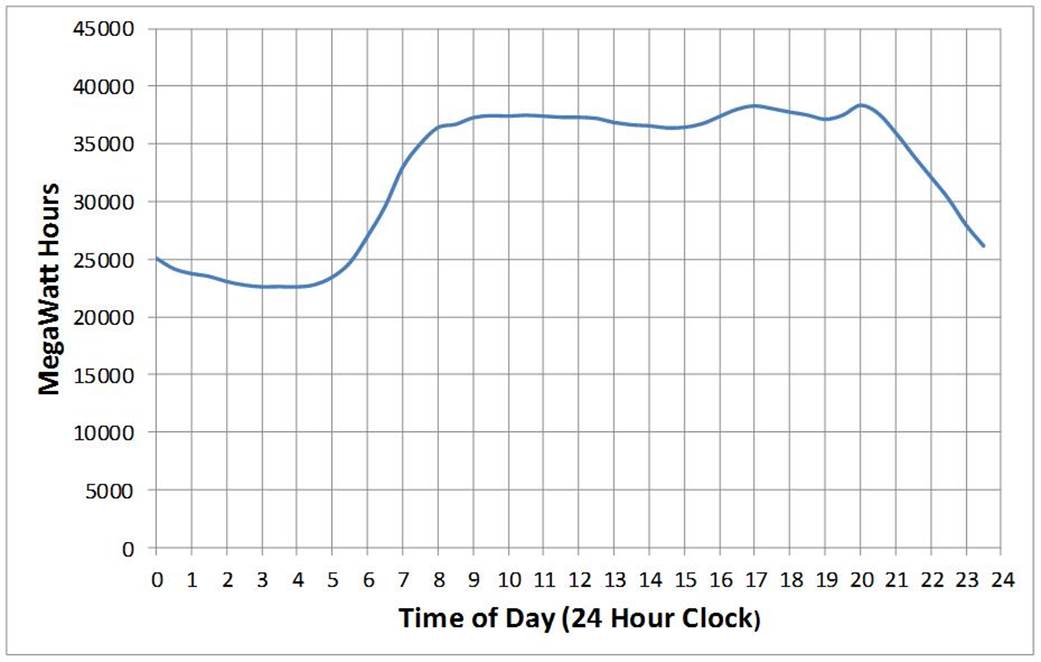
Source: Initial Demand
Out-Turn for 2014-09-03 as reported by www.bmreports.com
In the UK electricity
market, each half-hour period in a day is considered a separate market with its
own auction. Bidders submit a quantity
that they are willing to sell or buy, as well as the price for which they are
willing to engage in the transaction.
Bid information is gathered together and a
system price is determined for the particular half-hour period. The figure below reports price by time of day
on September 3, 2014. (This is called
the “reference price” and is reported by APX Power.) Notice that price was low in the early
morning hours, at around £35 per MWh, and began to go up after 5:00 a.m. just
as demand was increasing. Price hit a
peak of £60 per MWh at both 17:00 and 20:00 (5:00 p.m. and 8:00 p.m.) before
falling back below £40 by the end of the day. The price peaks at 17:00 and
20:00 matched the demand peaks at exactly the points in the day. But notice that price changed a lot more than
demand was changing! This high degree of
price volatility is common in wholesale electricity markets.
Reference Price of Electricity in Great Britain on Sept. 3,
2014
(British Pounds per MegaWatts
Hour, by Time of Day)
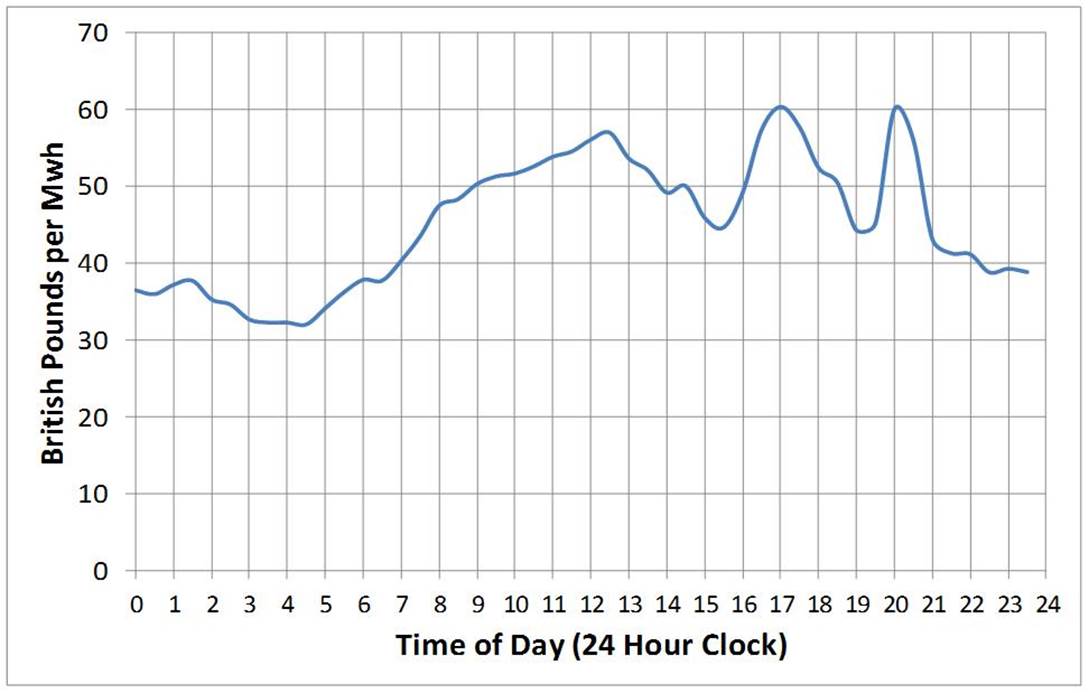
Source: APX Power
Reference Price for UK on 2014-09-03 as reported by www.bmreports.com
We
will illustrate how wholesale electricity markets work in a simple
example. It is common in these markets
for there to be an entity in charge of the auction called the Independent System Operator, who takes
the bids and determines the price that will clear the market. In our hypothetical example, let’s assume
demand at 10:00 is projected to be 40.5 megawatts. Suppose the independent system operator
receives the following bids to sell electricity.
Table 1
Example Bids Submitted
for 10:00 (unsorted)
|
Bidder Name |
Sell Price (£ per MHh) |
Quantity Offered (MHh) |
|
Power Gen |
24.00 |
15 |
|
Smelly Coal
Plant, Inc |
28.18 |
10 |
|
Ye Old Time
Electric |
40.00 |
10 |
|
Big Nukes,
Inc |
10.00 |
20 |
The
job of the independent system operator is to process the bid information to
determine (1) which suppliers will produce and how much each produces and (2)
the system price will be that each supplier will be paid. The first step in the process is to sort the
bids from lowest to highest. Lower
bidders are always in before higher bidders.
The next step is to add up the cumulative quantity supplied as we go
from the lowest to the highest bidders.
The trick is to go down the supply list until there is enough supply to
meet the demand (here 40.5 MWh). The
system price is set to be the bid offered by the last bidder in. All suppliers with lower bids get paid the
system price.
Let’s
pretend we are the independent system operator.
To process the bid information, it useful to set up a worksheet like
this that sorts the bids from lowest to highest:
Table 2
Independent System
Operator Worksheet
|
Bidder Name |
Sell Price (£ per MHh) |
Quantity Offered (MHh) |
Cumulative Quantity
Offered |
Market Demand |
Auction Result (amount
sold) |
|
Big Nukes,
Inc |
10.00 |
20 |
20 |
40.5 |
20 |
|
Power Gen |
24.00 |
15 |
35 |
40.5 |
15 |
|
Smelly Coal
Plant, Inc |
28.18 |
10 |
45 |
40.5 |
5.5 |
|
Ye Old Time
Electric |
40.00 |
10 |
55 |
40.5 |
0 |
In order to get a cumulative quantity
supplied big enough to meet the demand of 40.5, we need to go to the third
bidder on the list, Smelly Coal Plant, Inc.
(These cells are highlighted in yellow.) The system operator stops here and sets the
system price to the £28.18 per MWh bid by Smelly Coal (the cell highlighted in
blue). The two lowest bidders sell the
entire quantities that they offer and they are paid
the system price of £28.18. As the last
one in, Smelly Coal sells only part of what it offers, in
order to exactly match demand. Ye
Old Time Electric doesn’t sell anything.
But note that if the weather were hotter that day and more air
conditioners were running, electricity demand would have been higher. If the increase in demand were big enough, Ye
Old Time Electric would need to be brought in, raising the system price to
£40.00. With a high bid like this, Ye
Old Time Electric likely has an old inefficient plant. A costly-to-operate plant like this will
generally operate only at periods of unusually high demand.
To
see what is going on, it is also useful to plot the bids on a graph like
below. We start by plotting the prices
and cumulative quantities offered by the suppliers, (beginning with the lowest
to the highest bidders). This is in blue
in the figure below. The demand of 40.5
is in red. The intersection point
determines the system price.
An
auction like the one just described takes place for each of the half hour
period of the day. Suppliers submit
their bids on a daily basis. In the early morning when demand is low, the
only suppliers that operate are the ones setting low bids like the bid of Big
Nukes, Inc, and the system price is low.
Later in the day when demand is high, the system price is high.
Other
places around the world have followed the United Kingdom’s lead in deregulating
wholesale electricity markets. For
example, California has a wholesale electricity auction market that shares some
of the features of the British market.