Econ 1101—Reading 5
International Application
Consumer Goods Manufacturing:
The Rise of
By Thomas J. Holmes, Dept. of
Economics,
Revised October 2014
for Econ 1101
Introduction
In
recent years, in a variety of consumer goods industries, China has emerged as a
manufacturing powerhouse. China already
dominates world markets in certain industries that require relatively
unsophisticated production technologies, like toys and low-end clothing. It also has been “moving up” to include
moderate quality products in its product line.
You can see this for yourself by checking out the Pottery Barn
website and viewing the moderate quality furniture that they sell that is quite
nice, much of it made in
The
rise of China has had a big impact on manufacturing plants making these goods
in the United States. This case study
provides an overview of the impact. Part
1 uses the case study as an opportunity to discuss the theory of exit in
competitive industries, expanding on the numerical example developed in
class. Part 2 presents some statistics
on how particular industries have been affected. Exit has been extremely high but some
industry segments have survived. We
discuss the economics of why some survive and others do not.
Part 1. The Impact of
Low Price Imports on a Competitive Industry
Let’s
use the numerical example from class to illustrate the impact of imports on the
domestic (i.e.,
·
The
same technology is available for all firms.
So each domestic firm has the cost structure illustrated in the left
side of Figure 1 below.
·
There
are no barriers to entry.
·
Input
prices to the industry do not go up as the industry expands.
Suppose
that initially there is no possibility of imports from China. This could be because China initially is not
developed enough to be competitive in the particular industry. Or it could be because of trade restrictions
keeping imports out. (There were trade
restrictions on textiles as discussed below.)
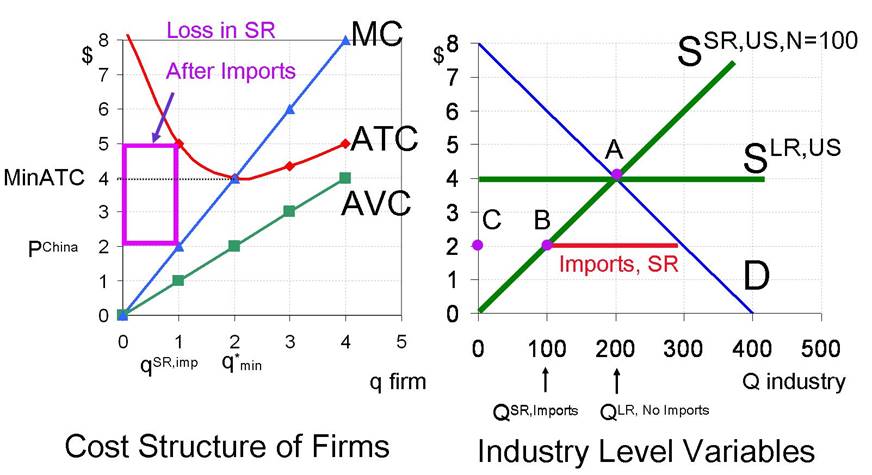
Like in class, we can use the information on the firm’s cost structure
(the left side of Figure 1) and the industry-level demand information (right
side of Figure 1) to determine the long-run competitive equilibrium in the
initial situation without imports:
1.
Equilibrium
price equals MinATC = $4 (This is the bottom point of
the U-shaped ATC curve)
2.
Equilibrium
industry quantity equals QLR, No Imports = 200 units. This is domestic demand at price equal to $4
3.
Each
domestic firm sets quantity equal to q*min = 2. This is where MC equals the price of $4. It is also the point where ATC is minimized.
4.
The
number of firms in the industry equals 100 = 200/2. (The 100 firms each produce 2 units so total
supply of 200 equals demand.)
This
takes us to point A in the figure
below.
Figure 1:
Example of the Effect of Imports in the Short Run and the Long Run
|
Variable |
Definition |
|
MC |
Marginal
Cost |
|
ATC |
Average
Total Cost |
|
AVC |
Average
Variable Cost |
|
MinATC |
Minimum of
Average Variable Cost |
|
q*min |
The quantity
where MinATC is attained |
|
SSR,US,N=100 |
The
short-run supply in the initial situation with 100 firms |
|
SLR |
The long-run
domestic supply curve for this industry. |
|
QLR,No Imports |
Domestic
production in the initial situation with no imports. |
|
QSR,Imports |
Domestic
production in the short run, after imports start coming in. |
|
Imports, SR |
Imports in
the short run when the number of firms is fixed at 100. |
|
Point A |
Initial
equilibrium with no imports |
|
Point B |
Short-run
equilibrium after imports start with the number of firms fixed at 100 |
|
Point C |
Long-run
equilibrium domestic production with imports.
All 100 firms exit. There is
zero domestic production. Domestic
demand equals 300 and this is met through imports. |
Now
suppose we have a new situation where imports from China begin to flow into the
U.S. Suppose the good can now be
imported from China at a price of $2.
This drives the price in the U.S. down to $2. In the short run, there remain 100 domestic
firms in the industry. At the lower
price, the domestic firms will contract output.
At the new price equal to $2, each firm reduces quantity to qSR,imp = 1 (where
marginal cost equals the new price). As
the firms cut output, they will cut variable inputs like labor. There are 100 domestic firms in the industry,
so total domestic supply in the short run equals QSR,Imports = 100×1 = 100. (This is point B on the short-run supply curve
with 100 firms.) At a price of P = $2,
demand in the U.S. equals 300 units. The
difference between the demand of 300 and the domestic supply of 100 is made up
by imports of 200 (labeled Imports, SR in the figure).
At
a price of $2, domestic firms lose money.
Each firm’s profit equals (P − ATC)×q or
(2 – 5) ×1 = –3. This loss is illustrated
by the purple rectangle on the left-hand side figure above. On account of this loss, in the long run, all domestic firms will exit the
industry and domestic production will be zero.
The entire demand of 300 units will be met through imports from China. Domestic production (now zero) corresponds to
point C in the graph.
This
is an extreme example, with imports causing the entire industry within the
United States to disappear. Now let’s discuss actual industries.
Part 2. Some Facts: Who is Surviving and Who is not?
In
work with John Stevens at the Board of Governors of the Federal Reserve Bank
(Holmes and Stevens (2014)), I have looked at industries that have been hit
particularly hard by imports from China.
The paper focuses on 17 industries as having been particularly impacted
by a surge of imports from China over the period 1997-2007. These industries are listed in the table
below taken from the paper.
Table 1: 17
Manufacturing Industries Hit by a Surge of Imports from China between 1997-2007
|
|
Import Share of Shipments (percent) |
China Share of Imports (percent) |
Percent
Change in U.S Employment 1997-2007 |
||
|
Industry |
1997 |
2007 |
1997 |
2007 |
|
|
Curtain &
drapery mills |
8 |
56 |
38 |
65 |
-47 |
|
Other
household textile prod mill |
22 |
68 |
25 |
49 |
-51 |
|
Women's &
girls' cut & sew dress |
29 |
67 |
21 |
55 |
-71 |
|
Women's &
girls' cut & sew suit, |
48 |
92 |
19 |
49 |
-91 |
|
Infants' cut
& sew apparel mfg |
60 |
99 |
08 |
62 |
-97 |
|
Hat, cap,
& millinery mfg |
44 |
80 |
26 |
67 |
-74 |
|
Glove &
mitten mfg |
58 |
88 |
50 |
63 |
-78 |
|
Men's &
boys' neckwear mfg |
25 |
56 |
02 |
59 |
-67 |
|
Other apparel
accessories |
39 |
80 |
35 |
64 |
-75 |
|
Blankbook, looseleaf
binder, |
18 |
47 |
43 |
52 |
-51 |
|
Power-driven handtool mfg |
28 |
56 |
18 |
46 |
-56 |
|
Electronic
computer mfg |
12 |
49 |
0 |
56 |
-68 |
|
Electric
housewares & fan mfg |
52 |
78 |
48 |
76 |
-54 |
|
Wood
household furniture mfg |
29 |
62 |
18 |
46 |
-51 |
|
Metal
household furniture mfg |
29 |
55 |
37 |
85 |
-48 |
|
Silverware
& plated ware mfg |
44 |
91 |
31 |
73 |
-82 |
|
Costume
jewelry & novelty mfg |
31 |
68 |
31 |
67 |
-63 |
|
|
|
|
|
|
|
|
Mean of China
Surge Industries (N=17) |
34 |
70 |
26 |
61 |
-66 |
The
import share of shipments equals the value of all imports (from any country) as
a share of imports plus domestically-produced shipments. For all the industries listed above, the
import share has increased at least 25 percentage points over the ten year period,
1997-2007. On average the import share
increased from 31 to 68 percent. The
table also lists the share of imports originating in China. For all the industries listed above, this
share exceeds 40 percent as of 2007. On average for these industries, the China
share increased from 31 to 67 percent.
This is a remarkably large increase in only a ten-year period.
The
last column of the table reports the decline in U.S. employment for these
industries over the ten-year period. The
declines are dramatic, averaging 66 percent.
Notice in particular what is happening in clothing industries. In the “infants’ apparel” industry,
employment declined 97 percent! The
apparel industry was particularly hurt because of a phase out of import quotas
that took place over this period as part of a world-wide trade
deal between developed countries like the U.S. and Europe and
developing countries. But the effects go
beyond the clothing industry. Look at
computers. In 1997, China accounted for
0 percent of computer imports. In only
10 years, China’s computer industry expanded to the point where it accounted
for 56 percent of imports.
So
what is left? For some industries, like
infants’ apparel, essentially nothing at all.
The industry has virtually shut down like what happens in the long run
in the example from Part 1. For other
industries, such as wood furniture, a sizeable part of the industry
remains. But the part of the industry
that has tended to survive is very different from the part that has left, as I
now explain.
In
1997 and earlier, the wood furniture industry was dominated in the United
States by places like Highpoint, North Carolina with huge furniture factories
with more than a thousand employees. The
factories tended to make standardized products aimed at the mass market. Industry migrated to factory towns like this
in the South many decades ago to take advantage of the low wages in the South
(compared to higher wage locations in the North like in New York and
Minnesota). The craft and
custom-oriented segment of the industry remained in various places throughout
the country. Craft production concentrated
in areas with a large local supply of skilled craftsman (such as Amish furniture
makers). Also, for custom work, it is
often helpful for the buyer to meet face to face with the producer. Few people want to go all the way to North
Carolina to meet the person making their furniture. So firms focusing on custom work tend to be widely
distributed throughout the country and focus on local markets.
Similarly,
as of 1997, much of the U.S. clothing industry was in large plants in southern
locations such as North Carolina, having migrated earlier from higher cost
locations such as New York. New York had
retained some of its garment industry, but it tended to hold onto the fashion
segment of the industry. For the fashion
segment, the benefits of a New York location offset the higher costs. Plants making fashion goods tend to be in small
plants producing output in small batches rather than mass production.
The
impact of China has been most severe in places like Highpoint, North Carolina
with large plants, with relatively unskilled labor. For example, while the wood
furniture employment fell 51 percent overall, in Highpoint it fell 72
percent. Plants doing custom work have
been hurt relatively less. The products
coming out of Chinese factories tend to be close substitutes to the products
coming out of the large North Carolina factories, and poor substitutes for
custom furniture made in Amish craft shops.
Similarly, in the clothing industry, products made in large factories in
China are close substitutes to products made in large factories in the South
and are very different from fashion goods made in New York. This explains why the garment industry has
fallen more in the South than in New York over the past ten years and why small
plants have increased their share of what is left of the industry.
In
summary, those segments of the industry that are surviving here are those for
which China’s comparative advantage is weakest relative to the U.S. These are the custom segments (which works
best when buyers and sellers are near each other) and niche, high-quality,
fashion-oriented segments, which rely on the high skill and creative energy to
be found in places like New York and Los Angeles. While these segments have fared the best, the
long-run prospects for U.S. production in these industries is not good. First, the custom and high-end niche segments
typically represent only a small part of an overall industry. (That is what makes them niche.) Second, advances in communication are
increasingly making it possible for custom projects to be worked out in
long-distance situations, diminishing the comparative advantage of domestic
producers in this segment. Third, China
is moving up the quality ladder, using the experience of massive production
levels at low rungs on the ladder to gain knowledge for climbing to next rungs
on the ladder.
References
Holmes, Thomas J. and John J. Stevens, "An Alternative Theory of the Plant Size
Distribution, with Geography and Intra- and International Trade,” with John
Stevens, Journal of Political Economy, Vol. 122, No. 2 (April 2014), pp.
369-421 Link
to prepublication version.
Lett, Erin and Judith Banister, “China’s
manufacturing employment and compensation costs: 2002–06,” Monthly Labor Review, April 2009, pp 30-38. Link
See also
Does
American Need Manufacturing,
Holmes, Thomas J. "The
Case of the The Case of the
Disappearing Large-Employer Manufacturing Plants: Not Much of a Mystery After
All," Economic Policy Papers, Federal Reserve Bank of
"With These Hands,"
Youtube trailer of 2009 film by Matt Barr. The film
is about the last day of work at the Hooker Furniture Factory, a plant near